
 Liquidity matters
Liquidity problems lead to more bankruptcies than any other cause. For such an important issue, it’s surprising how much confusion there is defining liquidity and measuring it. In this post we’ll try to add some clarity to the discussion about what liquidity is and how to analyze it.
What liquidity is
One textbook describes liquidity as “The ability of a firm to meet its current obligations.” An online financial dictionary defines it as “cash to meet immediate and short-term obligations, or assets that can be quickly converted to do this.” A major corporation discusses liquidity in terms of “Access to sufficient funding to meet our business needs and financial obligations.”
So which is it? The capacity, regardless of source, to meet any need, regardless of type? Cash and ready-to-sell assets available for needs emerging any time from the next few days through the next year? Financing for working capital, capital spending, debt service, and the dividend? The answer, of course, is, “all of the above.”
We think the most useful way to think about liquidity is in three dimensions: internal and external sources, operating and financial needs, and predictable or unpredictable needs. Our definition includes all three aspects: liquidity is the ability to meet expected and unexpected business and financial needs from internal and external sources of funds.
Sources and uses
Companies get the cash they need for liquidity from a variety of sources. Internal sources are those under their direct control, meaning cash generated by their operations and assets they own. They include free cash flow, cash and investment reserves, asset sales, and operating efficiencies.
Expected needs are predictable uses of cash like operating costs, capital expenditures, debt service, and dividends, and may have a predictable pattern, such as a seasonal build in inventory and accounts receivable. They are fairly easy for a company to put into cash flow forecasts. Unexpected needs are difficult-to-predict uses like legal judgments, strikes, supply chain disruptions, product recalls, or the uninsured costs of disasters.
Liquidity position
There are a number of ways to evaluate a company’s liquidity. The current ratio has been in use for a long time, but because of the current ratios limitations, new measures are emerging. The best of them focus on a wider range of liquidity sources, prioritize liquidity uses, and recognize the dynamic nature of liquidity.
Liquidity position is a prominent new measure. Although it hasn’t made it into the textbooks yet, it gets used more and more by companies, financial analysts, and journalists. One example it is Philips, the Dutch electronics firm, whose 2016 annual report includes a detailed discussion of what it calls its “liquidity position.”
We think the best way to calculate liquidity position is: Liquidity position = Cash reserves + Unused committed borrowing capacity – Short-term debt – Current portion of long-term debt. This approach focuses on a company’s most readily available internal and external sources of funds and compares them to its most important short-term uses of funds.
A company can tap its cash reserves and draw down on its committed credit lines very quickly. There is none of the delay associated with other sources of liquidity such as asset sales, operating efficiencies, or financial efficiencies. There are other important financial obligations, like supplies, payroll, and taxes. But because of cross-default provisions, debt repayment is the most potent current liability of all; miss a debt payment, and all debt can become due at once.
Kodak’s liquidity
On January 19, 2012, Eastman Kodak Company declared bankruptcy to “improve liquidity,” as the company said in its filing. For years the company had been struggling with the decline in its conventional film business. But it failed to create a big enough digital photography business, and, faced with declining liquidity, it finally was forced into bankruptcy.
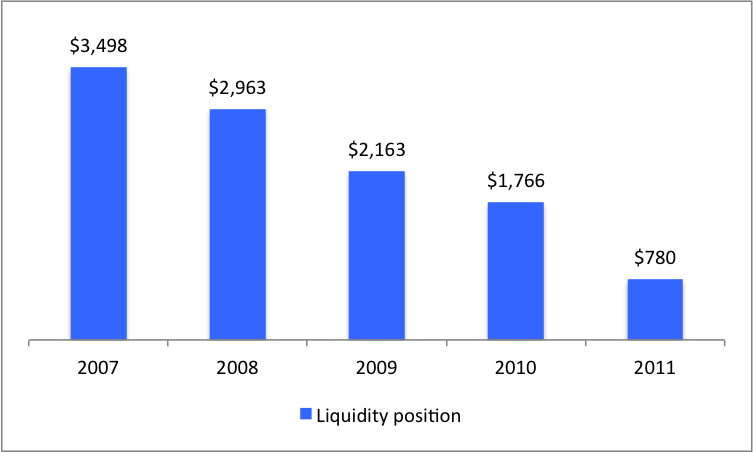
Kodak’s liquidity position fell from $3.5 billion at the end of 2007 to $780 million at the end of 2011. The entire company shrank over that period, with sales falling from $10.3 billion in 2007 to $6.0 billion in 2011. But the loss of liquidity was even greater.
The big change was in sources of liquidity. Cash as a percent of total assets was fairly consistent, ranging between 18 and 26% during those five years. The real problem with liquidity came from a sharp fall in bank credit. In 2007 and 2008, Kodak had a $1.0 billion secured revolving credit. But as losses grew, the banks soured on the company, and its revolving credit commitment fell to only $400 million.
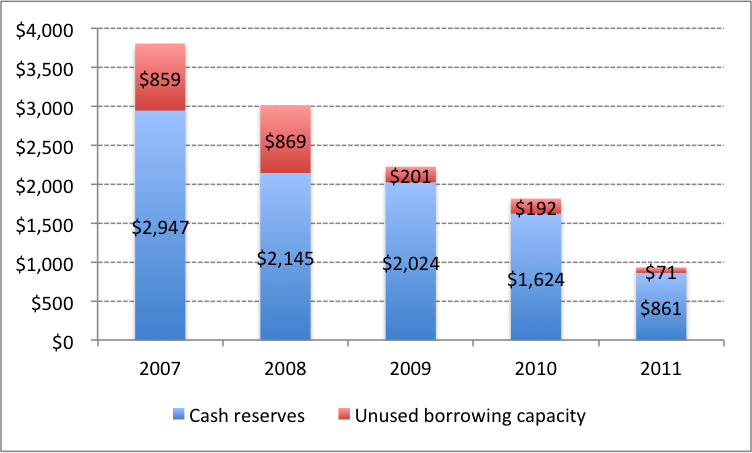
Without that bank credit, the key external source of liquidity, and with a relentless decline in cash reserves, the key internal source, Kodak’s fate was sealed. It had small debt maturities: only $152 million in current debt at the end of 2011. But to keep up with its other obligations and have the financial strength for a drastic business restructuring, Kodak had to protect the liquidity it had left. And so it filed.
Strengths and weaknesses
The liquidity position does a good job of capturing Kodak’s decline and explaining its bankruptcy. It is an effective measure of a company’s immediate, critical net financial resources. And, unlike cash flow forecasts and stress tests, it is fairly efficient to calculate. All you need is a few items from the balance sheet (cash and current debt) and some information from the notes to the financial statements (committed credit facilities and usage).
Its biggest weakness is that it’s static, a period-end measure taken at a single point in time. Liquidity is dynamic. It’s best to measure it using cash flow forecasts with downside scenarios, when its worth the extra effort. But unless the risk is high or the exposures are large, we think the liquidity position is an effective stand-alone tool for analyzing a company’s liquidity.